Search Archives
Contributors
  • Bill Chuck - Managing Editor
  • Dave Golebiewski
  • Daniel McCarthy
  • David Pinto
  • Jonathan Scippa
Follow Us

Analytics Posts
  • Baseball Analytics Blog RSS
Featured Sponsors


What's New

Mailing List
Email Newsletter icon, E-mail Newsletter icon, Email List icon, E-mail List icon Sign up for our Email Newsletter
For Email Marketing you can trust
Twitter Feeds

This site utilizes the MLB analytics platform powered by TruMedia Networks

Entries in Clayton Kershaw (14)

Monday
Jan202014

Clayton Kershaw's $215 Million Curveball

There are myriad reasons why Dodgers lefty Clayton Kershaw just earned a seven-year, $215 million contract extension, becoming the first player in history to pull in more than $30 million a season. Kershaw, 26 in March, boasts the fifth-best park-and-league-adjusted ERA (46 percent above average) ever for a starting pitcher during his first six seasons in the majors, trailing only Walter Johnson (164 ERA+), Mordecai Brown (158 ERA+), Smoky Joe Wood (152 ERA+) and Christy Mathewson (150 ERA+). He's a workhorse, having topped 200 innings pitched in each of the past four seasons, and he has fooled hitters like no other lefty (9.2 strikeouts per nine frames) this side of Randy Johnson (9.4 K/9) to start his career.

Yet for all of the breathtaking stats that Kershaw has compiled since making his debut at Chavez Ravine back in May of 2008, this one may be the most remarkable: he has thrown a total of 2,155 curveballs during the regular season, according to our Pitch F/X data, and exactly zero of those hooks have landed in the cheap seats. That's right -- Kershaw has never surrendered a regular-season homer on the pitch that earns him comparisons to Sandy Koufax. Batters have launched 1,945 home runs off curveballs dating back to '08, but nobody has gone deep against Public Enemy Number One.

What in the name of Vin Scully is going on here? How has Kershaw been so thoroughly dominant with his curveball, which has smothered hitters to the tune of a major league low .145 opponent slugging percentage from 2008-13? Here are three reasons why Kershaw's curve seemingly can't be taken deep.

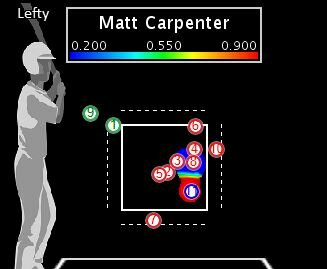
Batters can't tell whether it's a ball or a strike -- or just don't think they can hit it

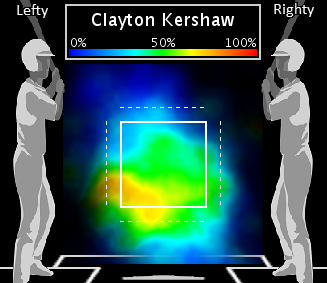
To go deep, you obviously have to swing the bat -- and opponents rarely do when Kershaw unleashes a curve. Batters have swung at just one-third of curveballs seen from Kershaw since '08, compared to the 40 percent major league average. Even when the pitch ends up being thrown in the strike zone, hitters pull the trigger less than half of the time (47 percent, compared to the 55 percent MLB average). Either batters can't discern whether it's over the plate in time to swing, or they figure it's futile to even try.

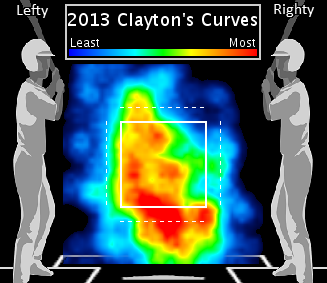
Hitters' swing rate by pitch location versus Kershaw's curveball, 2008-13

Kershaw's curve induces weak contact

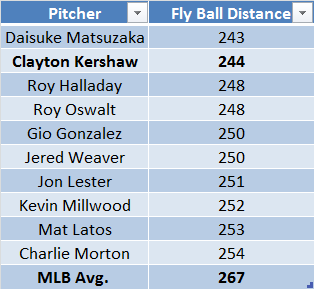
When hitters do swing at Kershaw's curve, they often just pound the pitch into the infield grass or hit a weak fly ball. Kershaw has generated grounders 55.2 percent of the time that batters have put his curve in play, north of the 52 percent MLB average. Those who manage to loft the pitch into the air have won a moral victory, but little else. Batters have hit fly balls off Kershaw's curve an average of 244 feet -- second-lowest among all qualified starters dating back to 2008.

Lowest Average fly ball distance on curve balls put in play, 2008-2013 (min. 800 curveballs thrown)  

Kershaw can add and subtract with his curve

L.A.'s ace has thrown his curveball at an average of 73.4 MPH during his career. But he can dial it way up (topping 82 MPH on the gun) or way, way down (he threw a 49 MPH yakker to Yasmani Grandal on September 9, 2012 -- Grandal didn't swing, of course). That might be part of the reason why hitters so rarely swing at Kershaw's curve -- it could be a power pitch, or it might arrive at home plate slower than a Prius traveling on Interstate 5.

Kershaw was wild with curveball when he first arrived in the bigs, throwing it for a strike less than half of the time, but he has gradually learned to control the pitch (57 percent strike rate last year) while adding precision to his power arsenal. His curve, like the rest of his game, has only gotten better. That's a scary proposition any hitter dreaming of finally going yard off the pitch.

Saturday
Oct192013

Matt Carpenter: Two-Strike Warrior

The St. Louis Cardinals scuffle against left-handed pitching, posting the fifth-worst team on-base-plus-slugging percentage (.672) in the majors in 2013. Clayton Kershaw, the game's lefty par excellence, is fooling hitters at a level that not even vintage Sandy Koufax matched (Kershaw's park-and-league adjusted ERA was 94 percent above average during the regular season, just beating out Koufax's epic 1966 campaign).

Naturally, then, the Cards crushed the soon-to-be two-time Cy Young Award winner last night, clinching a World Series berth by tagging Kershaw for 10 hits and seven runs in four innings pitched. The beginning of the end for Kershaw came in the third inning, when Matt Carpenter got down to his last strike but then waged an 11-pitch battle culminating in a double to right field for the stealth NL MVP candidate. St. Louis went on to score four times in the frame on their way to a 9-0 triumph. Here's how the Kershaw-Carpenter duel played out in NLCS Game Six, pitch by pitch:

  • 0-0 - Ball on a 89 MPH Slider - Inside
  • 1-0 - Foul on a 94 MPH Four Seamer - Over the Plate
  • 1-1 - Foul on a 94 MPH Four Seamer - Over the Plate
  • 1-2 - Foul on a 95 MPH Four Seamer - Over the Plate
  • 1-2 - Foul on a 75 MPH Curveball - Over the Plate
  • 1-2 - Foul on a 88 MPH Slider - Over the Plate
  • 1-2 - Foul on a 86 MPH Slider - Low
  • 1-2 - Foul on a 94 MPH Four Seamer - Over the Plate
  • 1-2 - Ball on a 93 MPH Four Seamer - Inside
  • 2-2 - Foul on a 94 MPH Four Seamer - Outside
  • 2-2 - Line Drive Double on a 86 MPH Slider - Over the Plate
  •  

    Kershaw pounded the outside corner for most of the at-bat, trying to target the second baseman's relative weak spot (Carpenter slugged .383 versus pitches thrown to the outer third of the strike zone during the regular season, compared to .457 on middle pitches and .702 on inner-third pitches). But Carpenter prevailed when Kershaw caught too much of the dish with his slider:

    Kershaw's pitch location to Carpenter in the third inning of Game 6

    How rare is it for Kershaw to surrender an extra-base hit to a lefty on his slider? Just three left-handed batters accomplished the feat during the regular season. Jay Bruce belted a pair of Kershaw sliders over the fence on September 9, Sam Fuld tripled on August 11, and Gerardo Parra doubled on June 10. That's it. That's the list.

    Perhaps we shouldn't be too surprised that Carpenter came out on top against Kershaw, considering his two-strike prowess in 2013. Carpenter has a .780 OPS with his back against the wall, besting the MLB average by 266 points and placing second to Miguel Cabrera among all qualified hitters.

    Highest OPS in two-strike counts, 2013

Tuesday
Sep242013

Breaking Bad

Sorry folks, this is not about Walter White, but it's a story about pitchers who throw the hook, the bender, Uncle Charlie, a yakker, the deuce, yes, my friends...the curve ball.

This is baseball's "Breaking Bad."

2013 top 10 curveball throwers

There has been nobody who has used the curveball more frequently this season, and most often quite successfully, than A.J. Burnett.
Most curves - 2013
P G BF
A. J. Burnett (PIT) 1,027 29 294
Adam Wainwright (STL) 950 33 263
Jose Fernandez (MIA) 876 28 268
Scott Feldman (BAL) 804 29 187
Edinson Volquez (LAD) 709 32 160
Gio Gonzalez (WSH) 683 31 155
Doug Fister (DET) 648 31 164
Stephen Strasburg (WSH) 629 29 157
Jose Quintana (CWS) 625 32 144
Yovani Gallardo (MIL) 623 30 134

Curveballs swings and misses

Here's why I think we haven't seen the best from the Rangers' Yu Darvish.

Darvish leads the majors in strikeouts, but wait until he feels comfortable calling on his Uncle Charlie a little more frequently.

You can see by the chart below, baseball's most effective curveball miss machine belongs to Yu.
2013 - Curveball Swings & Misses
P Swng% Miss% Foul%
Yu Darvish (TEX) 96 32.3% 51.6% 22.6%
Madison Bumgarner (SF) 426 39.9% 42.4% 24.1%
A. J. Burnett (PIT) 1,027 51.2% 42.0% 28.9%
Doug Fister (DET) 648 41.7% 41.5% 24.8%
Stephen Strasburg (WSH) 629 36.2% 40.4% 28.5%
Clayton Kershaw (LAD) 413 44.6% 39.7% 25.0%
Mike Minor (ATL) 416 50.2% 37.3% 27.8%
Jordan Zimmermann (WSH) 363 28.7% 36.5% 25.0%
Edwin Jackson (CHC) 132 40.2% 35.8% 28.3%
Cliff Lee (PHI) 241 45.2% 35.8% 32.1%

Fooling batters

There are two primary ways in which I evaluate a batter being fooled on a pitch: the first being chasing pitches out of the zone, and the second, taking the pitch for a called strike.

Now before you start emailing how ridiculous that is, I understand that circumstances, umpires, counts, and other reasons factor into a batter chasing a pitch or taking a pitch, but over the course of the season, if a pitcher is tossing balls that batters chase, have their knees buckled as they break over the plate, or just get a piece of to stay alive, the man is throwing a good curveball.

Here are the leaders:
2013 - Chase, Called Strikes and Fouled off Curveballs
P Chas% ClStk% Foul%
A. J. Burnett (PIT) 1,027 42.1% 29.1% 28.9%
Mike Minor (ATL) 416 39.6% 24.2% 27.8%
Jose Fernandez (MIA) 876 37.5% 41.6% 35.8%
Wade Miley (ARI) 81 37.0% 16.7% 43.6%
Derek Holland (TEX) 151 36.4% 39.8% 31.7%
Mark Buehrle (TOR) 234 36.1% 25.2% 34.1%
Adam Wainwright (STL) 950 35.2% 38.3% 31.2%
Matt Harvey (NYM) 351 33.1% 45.7% 31.6%
A. J. Griffin (OAK) 497 32.8% 31.0% 33.6%
Mike Leake (CIN) 423 30.7% 40.7% 27.3%

Whiffs

Great pitchers know how and when to use their curveball effectively. The best example comes from baseball's best pitcher, Clayton Kershaw, who strikes out more batters on the curve than any other pitcher.

When you look at the chart below, look at all the elements we have previously addressed, including miss rate, chase rate, foul balls
2013 Curveball Strikeout Leaders
P PA K% Strk% ClStk% Swng% Miss% Zone% Chas% Foul%
Clayton Kershaw (LAD) 413 141 53.9% 56.4% 21.4% 44.6% 39.7% 41.6% 28.6% 25.0%
Dan Haren (WSH) 129 19 52.6% 54.3% 37.2% 27.1% 34.3% 41.1% 17.1% 40.0%
Stephen Strasburg (WSH) 629 157 52.2% 64.2% 43.9% 36.2% 40.4% 50.7% 29.0% 28.5%
Wade Miley (ARI) 81 20 50.0% 56.8% 16.7% 48.1% 30.8% 33.3% 37.0% 43.6%
Cliff Lee (PHI) 241 69 47.8% 58.5% 24.2% 45.2% 35.8% 46.5% 26.4% 32.1%
Madison Bumgarner (SF) 426 113 46.0% 53.5% 22.7% 39.9% 42.4% 33.3% 29.9% 24.1%
Gio Gonzalez (WSH) 683 155 45.8% 51.8% 25.9% 35.0% 35.1% 38.1% 24.1% 32.2%
Cole Hamels (PHI) 238 63 44.4% 53.8% 21.4% 41.2% 34.7% 37.4% 27.5% 34.7%
Jose Fernandez (MIA) 876 268 43.7% 69.9% 41.6% 48.4% 33.0% 55.6% 37.5% 35.8%
A. J. Burnett (PIT) 1,027 294 43.5% 65.4% 29.1% 51.2% 42.0% 39.9% 42.1% 28.9%

Hitting against the curve

Don't focus on Jerome Williams here, I want you to notice that batters are 14 (singles) in 141 PA against Clayton Kershaw's curve this season. Kershaw is the Sophia Vergara of baseball, his curves are so good.
Here are the numbers:
2013 - Hitting Against the Curveball
G PA AVG OBP SLUG OPS H XBH HR
Jerome Williams (LAA) 32 38 .081 .105 .135 .240 3 2 0
Clayton Kershaw (LAD) 32 141 .099 .099 .099 .199 14 0 0
Gio Gonzalez (WSH) 31 155 .108 .143 .162 .305 16 5 1
Jose Fernandez (MIA) 28 268 .114 .176 .163 .339 28 8 2
Stephen Strasburg (WSH) 29 157 .137 .159 .183 .342 21 5 1
Mat Latos (CIN) 31 69 .141 .176 .219 .395 9 4 0
Dillon Gee (NYM) 31 65 .145 .185 .161 .346 9 1 0
Madison Bumgarner (SF) 31 113 .147 .170 .220 .390 16 6 1
Ian Kennedy (SD) 30 74 .149 .230 .224 .454 10 3 1
A. J. Burnett (PIT) 29 294 .155 .192 .209 .400 43 12 1

There's breaking bad and breaking bad


2013 - 13 Pitchers w/.300+ BA Against the Curve
G PA AVG OBP SLUG OPS H XBH HR
Travis Wood (CHC) 18 7 .667 .714 1.000 1.714 4 2 0
Jarrod Parker (OAK) 7 2 .500 .500 .500 1.000 1 0 0
CC Sabathia (NYY) 32 13 .385 .385 .692 1.077 5 2 1
Edwin Jackson (CHC) 22 23 .381 .435 .524 .959 8 2 0
Kyle Lohse (MIL) 31 50 .362 .375 .511 .886 17 5 1
Derek Holland (TEX) 30 32 .355 .344 .903 1.247 11 7 5
Andy Pettitte (NYY) 29 52 .333 .333 .417 .750 16 4 0
Eric Stults (SD) 32 88 .329 .341 .506 .847 28 9 2
Jeremy Guthrie (KC) 31 59 .322 .322 .508 .831 19 5 3
Joe Saunders (SEA) 32 52 .320 .333 .600 .933 16 6 4
Miguel Gonzalez (BAL) 28 31 .310 .323 .448 .771 9 4 0
Bronson Arroyo (CIN) 31 70 .309 .329 .574 .902 21 9 4
Hyun-Jin Ryu (LAD) 28 72 .300 .319 .471 .791 21 8 2

One final suggestion

To be added to the baseball vernacular: a hanging curve that is hit for a homer should be called? A Heisenberg...because it was breaking bad.
Page 1 2 3 4 5 ... 5 Next 3 Entries »