Top
Search Archives
Analyze This

Do you have something you would like to analyze? Send us a note and we will be happy to do the research!

What's New

In Broadcast Analysis
Twitter Feeds

This site utilizes the MLB analytics platform powered by TruMedia Networks

Entries in Chris Volstad (3)

Thursday
Jan052012

Volstad's Act Against Lefties Predictable

Theo Epstein and Jed Hoyer accomplished two goals on Thursday by sending Carlos Zambrano on the next flight out of town and adding cost-controlled pitching depth, picking up Chris Volstad from the Marlins. Volstad, 25, has three years of arbitration eligibility remaining and could end up being a quality mid-to-back-of-the rotation arm. The towering righty actually had a better Fielding Independent ERA than Zambrano last year (4.32 to Z's 4.59), though Volstad's ERA was over a half-run higher due to a whopping 15.5 of fly balls he gave up leaving the park.

Considering Chicago's bleak hopes of contention in 2012 and the dearth of pitching at the upper levels of the minors, adding Volstad is a nice upside play. But if the 2005 first-rounder is ever going to more than a passable rotation piece, he will need to stop being so predictable -- and hittable -- against left-handers.

Over the last three years, Volstad has allowed fellow right-handers to hit .278/.333/.411. That is by no means great (the average for righty starters versus righty batters is .258/.314/.409 over that time frame), but it looks stellar compared to his work against left-handers. Portside hitters have violated Volstad for a .284/.345/.492 line since '09 (.268/.335/.427 average for righty starters versus lefty hitters).

Volstad mixes up his pitches against lefties, tossing four-seamers (about 30 percent of the time), sinkers (30 percent), changeups (23 percent), curveballs (13 percent) and sliders (four percent). The problem is, everything he throws is on the outside corner. Look at his pitch location against opposite-handed hitters, compared to the average for right-handed starters to lefties:

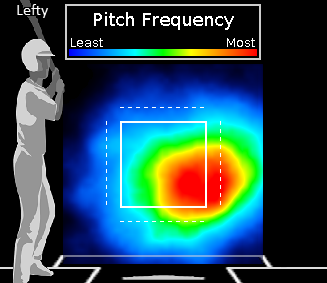
Volstad's pitch location to left-handed hitters, 2009-2011

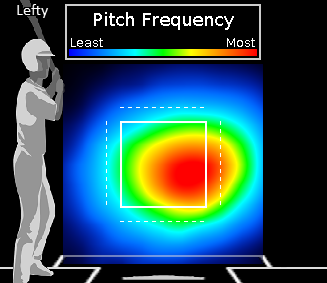
Average pitch location for right-handed starters to left-handed hitters, 2009-2011Most righties pitch lefty hitters outside, but Volstad takes it to another level. Volstad has thrown 60 percent of his pitches on the outside corner to lefties (53 percent average for righty starters versus lefty hitters), while going inside just 18 percent of the time (24 percent average).

Lefty hitters seem well aware of Volstad's outer-third approach. Check out their swing rate by location against Volstad's pitches, and then the average swing rate by location for lefty hitters against righty starters:

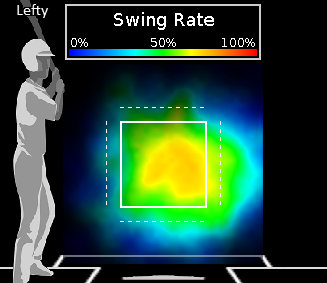
Left-handed hitters' swing rate by pitch location vs. Volstad, 2009-2011

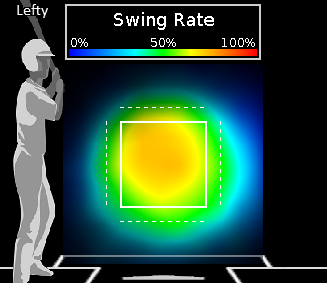
Average swing rate by pitch location for left-handed hitters vs. right-handed starters, 2009-2011

Lefties have swung at slightly more than 43 percent of Volstad's pitches thrown on the outer third over the past three seasons, well above the 39 percent average. With few inside pitches, lefty hitters are waiting for those outer-third pitches and then racking up extra-base hits.

Volstad is young, fairly inexpensive (MLBTradeRumors' Matt Swartz projects he'll earn $2.6 million in arbitration) and does a good job of limiting walks and getting ground balls. That is an appealing package for a team starved for talent on the right side of 30. But right now, left-handed hitters have no reason to worry about getting pitches in on the hands and are taking advantage of Volstad's predictable outside strategy. Maybe pitching coach Chris Bosio can help him develop a cutter to keep lefties honest.

Thursday
Jan052012

Hitters Teeing Off on Big Z's Heat

I can't wait for the third and final season of HBO's Eastbound & Down to start in February, but Kenny Powers' antics might look downright prudish compared to what goes down in the Miami Marlins' clubhouse next year. You've got a brand new park arousing SEC suspicion, a manager in need of a three-second tape delay, two star shortstops on the left side of the infield, an Elvis-impersonating closer, and a Twitter-loving left fielder. And now, add Carlos Zambrano to that South Beach powder keg.

The Cubs shipped Big Z to the Marlins for young but lefty-and-homer-prone starter Chris Volstad. Chicago will cover $15 million of Zambrano's $18 million salary for 2012 (no word on whether the Cubbies will chip in for the extra Gatorade dispensers and Louisville Sluggers the Fish will inevitably need). Zambrano waived a $19 million option for 2013 that would have vested if he finished in the top four in Cy Young voting.

While Big Z was once good for 200-plus innings and a sub-four ERA, he's a far cry from Cy Young form these days. The 30-year-old right-hander is coming off his worst season in the majors, striking out a career-low 15.9 percent of batters faced, surrendering a career-high 1.17 HR/9 and posting a career-worst 4.59 Fielding Independent Pitching in 145.2 innings before calling it quits on August 12 after a five-homer outing against the Braves. Volstad actually had a lower FIP, at 4.32.

Zambrano's on-field woes can mostly be traced to his heat. His fastball didn't miss nearly as many bats as usual, and his sinker, well, didn't.

In 2009, hitters slugged .381 against Z's fastball and missed the pitch 16.6 percent of the time they offered at it. Zambrano's fastball was even better in 2010, limiting batters to a .242 slugging percentage with a 21.6 miss percentage (those are just his numbers as a starter, to make an apples-to-apples comparison). But in 2011, opponents teed off to the tune of a .513 slugging percentage and they missed Z's fastball just 11.5 percent. Lefties were especially troublesome, slugging .589 and missing just 10.4 percent of fastballs swung at. Z has lost some zip on the pitch, averaging 90.2 mph compared to 90.6 in 2010 and 91.5 mph in 2009.

In '09 and '10, Zambrano did a good job of limiting contact on fastballs thrown at the knees or at the tip of the strike zone. Check out his fastball contact rate by pitch location, compared to the league average:

Zambrano's fastball contact rate by pitch location, 2009-2010

Average fastball contact rate by pitch location, 2009-2010

This past year, though? Zambrano was seeing red just about everywhere in the zone, and that was particularly the case in the lower half:

Zambrano's fastball contact rate by pitch location, 2011While Z's fastball got hit more often and harder, his sinker refused to stay down. Zambrano threw about 14 percent of his sinkers high in the strike zone in 2009. That increased to 25.5 percent in 2010 and spiked to 28 percent this past year (the average for starters is about 23 percent).

With Zambrano putting more sinkers on a tee, opponents' slugging percentage against the pitch climbed from .343 to .444 to .489. Those high sinkers are the ones hitters scorched last year:

Opponents' in-play slugging percentage vs. Zambrano's sinker, 2011

Zambrano threw fewer fastballs and sinkers than usual in 2011 (a combined 50.5 percent, down from around 54 percent the two previous years), yet 13 of the 19 homers he coughed up came on those pitches.

The Marlins aren't taking much of a financial risk in adding Zambrano to a rotation that already includes Josh Johnson, Anibal Sanchez and Mark Buehrle, and the club's new stadium may well play as a pitcher's park that aids Z in keeping the ball in the park. But if Zambrano doesn't miss more lumber with his fastball and get his sinker to sink, Miami could regret giving up three years of Volstad for one year of mercurial mediocrity.

Friday
Jun032011

Chris Volstad's Changeup Success: Unsustainable?

Chris Volstad (FLA) has done well throwing the changeup this season.  He's second in opponent's batting average (.063) behind Ryan Madson's change (.057).  Last year, opponents hit .246 against his changeup, putting Volstad in the bottom half of the league. 

Here's a look at how his changeup this season compares to last.

Chris Volstad's Changeup Movement
VEL BrkX BrkZ
2010 84.1 4.9 4.0
2011 83.9 7.0 2.7

Volstad has lost a little vertical movement (BrkZ) on his changeup, while gaining some horizontal movement (BrkX).

Chris Volstad's Changeup Results
P Swing% Miss% Chas% AVG BABIP
2010 580 47.2% 25.5% 34.1% .246 .284
2011 105 36.2% 28.9% 30.7% .063 .067

Batters have swung less and chased fewer of Volstad's changeups this season. Yet, they have swung and missed slightly more and failed to produce more than one hit. Perhaps the increase in left to right movement on the pitch has been more effective against batters, even at the expense of less downward movement.

I'd hesitate to suggest he will be able to sustain this success. Batters still make a great deal of contact against his changeup. Volstad has struck out only two batters with it this season. However, he's only thrown the change 13 times with two strikes. Given that a BABIP correction is more than likely forthcoming, he'll need to start throwing the change more when batters are down in the count.