With the first game of the ALCS less than an hour away, let's take a quick look at the pitch frequency for a player that has been so instrumental in the New York Yankees postseason success: Mariano Rivera.
As the heatmap below shows, Mariano Rivera has an amazing ability to command the strike zone.
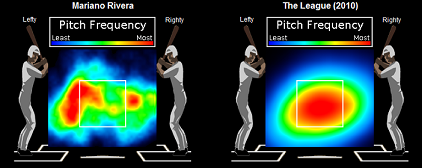 Mariano Rivera's 2010 Pitch Frequency vs. All Major League RHP Notice how Rivera barely touches the middle of the plate.
Here are Rivera's Righty-Lefty heatmaps vs. the rest of the league:
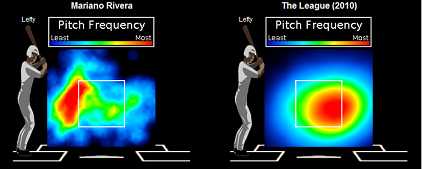 Mariano Rivera's 2010 Pitch Frequency against LHB (439 pitches) vs. All 2010 Major League Pitchers
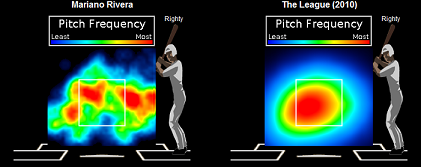 Mariano Rivera's 2010 Pitch Frequency against RHB (476 pitches) vs. All 2010 Major League PitchersAs you can see from the top map, Rivera lives on the inside corner to lefty batters. In fact, the majority of his pitches fall outside the designated strikezone. Meanwhile, the rest of the league favors throwing down and away to LHB.
Against RHB, Mo spreads out his pitches a bit more. However, notice how he barely ever throws to the middle inside part of the plate to righties. He also busts righties up and in, again in contrast to the rest of the league.
As a matter of comparison, here are the pitch frequency heatmaps for 3 other AL closers:
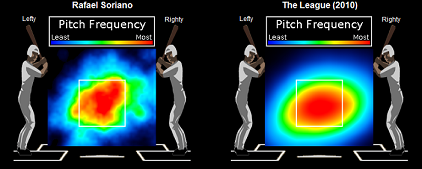 Rafael Soriano's 2010 Pitch Frequency (890 pitches) vs. All 2010 Major League RHP
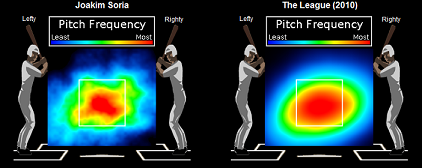 Joakim Soria's 2010 Pitch Frequency (1086 pitches) vs. All 2010 Major League RHP
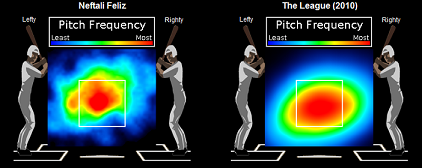 Neftali Feliz's 2010 Pitch Frequency (1072 pitches) vs. All 2010 Major League RHPAll three of the above closers tend to pitch to the middle of the plate, a striking contrast to Rivera's pitch frequency.
Lastly, here's a look at Rivera's pitch frequency since 2008:
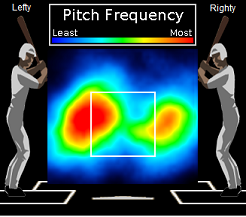 Mariano Rivera's Pitch Frequency since 2008
 MLB Heat |