Search Archives
Contributors
  • Bill Chuck - Managing Editor
  • Dave Golebiewski
  • Daniel McCarthy
  • David Pinto
  • Jonathan Scippa
Follow Us

Analytics Posts
  • Baseball Analytics Blog RSS
Featured Sponsors


What's New

Mailing List
Email Newsletter icon, E-mail Newsletter icon, Email List icon, E-mail List icon Sign up for our Email Newsletter
For Email Marketing you can trust
Twitter Feeds

This site utilizes the MLB analytics platform powered by TruMedia Networks

Entries in Joey Votto (9)

Thursday
Dec262013

A Patient Trout is a Better Trout

Mike Trout has become best known for several things during his brief tenure in the major leagues, including (but not limited to) the following: Plus bat speed, which has enabled him to hit for a high average and produce screaming line-drive home runs with consistency, and above-average baserunning and defense, which has empowered him to nab bases at a ridiculously high rate and play eye-opening defense in center field. Both of these dexterities have been on display in his first two full seasons, holding true to a .324/.416/.560 slash line, 87.2% stolen base rate and 1.4 defensive WAR rating, according to Baseball Reference. But like just about every professional player, Trout has his deficiencies.

Well, had his deficiencies.

The one knock on Trout coming into his sophomore 2013 campaign -- and it wasn't really a "knock," to be honest -- was his plate discipline. While each of his offensive attributes were considered elite by scouting standards, this aspect of his game was only average at best. Trout struck out at a 21.8% clip as a rookie, which was higher than the league-average mark of 18.1% two seasons ago, and didn't draw too many walks, shown by a 10.5% walk rate that was only slightly above the 8.1% average rate. This left many wondering if a 'sophomore slump' would ensue in 2013 as advanced scouting reports of his game become available.

Boy do those people feel silly.

All Trout did last season was trim his strikeout rate by 2.8% and increase his walk rate to 15.4% -- the highest mark of any qualified right-handed batter in baseball. Sure, his batting average and slugging percentage decreased by inconsequential marks and he stole fewer bases, but his on-base percentage skyrocketed to .432 last season (third-best in baseball behind Miguel Cabrera (.442) and Joey Votto (.435)), and that was the driving force behind his elevated offensive value last season compared to his rookie campaign.

How was he able to get on base more frequently? Let's take a look.

Improved Eye at the Plate

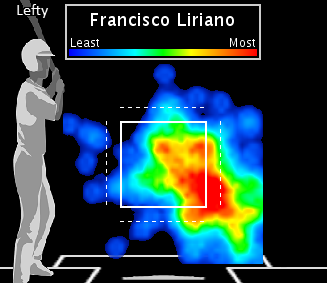
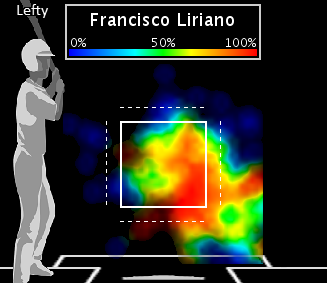
Only 69.3% of Trout's 2012 hacks were on strikes, compared to 71% in 2013. The league average since 2012 is 67.7%.

Along with lowering his chase rate to 20.8% last season (compared to 24.3% in 2012), Trout pulled the trigger less frequently than any other qualified batter in baseball last season, evidenced by a 37.0% swing rate. This puts him in company with some of the most disiplined hitters in the league, including Marco Scutaro (whose 16.9% chase rate was the lowest of any qualified batter in 2013) and Joe Mauer (whose 35.9% swing rate since 2012 is the lowest in baseball).Yes, Trout was slightly less reluctant to offer at non-strikes than those two, but his improvements in that respect last season give reasons to believe he will become even more disciplined in the years to come.

Efficient with his swings

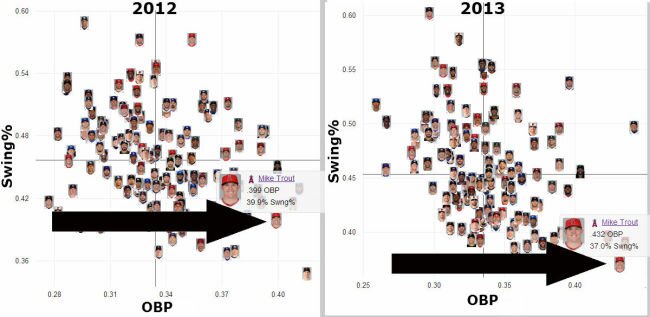
On top of pulling the trigger less frequently (37.0%) than any other qualified batter last season, Trout posted baseball's third-highest on-base percentrage (.432), as previously noted. But why are these two metrics noteworthy? As we see from the graph to the right, Trout -- along with Votto's 38.9% swing rate and .435 OBP -- was essentially the most efficient hitter in baseball last season at getting on base while still hacking less frequently than any other batter. Cabrera posted a league-best .442 OBP last season, but offered at 49.7% of all offerings thrown to him. Thus, Trout was much more efficient at finding ways to get on base than Cabrera, which shows he employs a more refined offensive approach.

Working the count

But improved plate discipline and swing efficiency only go so far. Perhaps the most relevant factor behind Trout's OBP rise stems from the increase in pitches seen per plate appearance.

It's important to establish right off the bat that Trout saw more pitches per plate appearance on average last season (4.21, which was sixth-best among qualified batters) than in 2012 (4.08). So, clearly, Trout has become more patient at the dish with time. As it turns out, this increase contributed to his increase in on-base percentage, shown by the graph above. While Trout's OBP in plate appearances lasting either one or two pitches last season were lower than two seasons ago, his OBP from pitch three and beyond were significantly higher, and continue to increase with each pitch. Interestingly enough, Trout's .454 OBP in plate appearances lasting three or more pitches was the highest mark among any qualified batter last season (along with a .316 BA, which was tops in the league, as well).

What we're learning is that when Trout goes deeper into counts (i.e. three or more pitches into a plate appearance), he is a much more effective hitter in that he gets on base at a rate no other professional batter can. Knowing this, opposing pitchers will likley try to get ahead of him early in the count by throwing over the plate -- which could also spell for disaster, as Trout boasts a .702 slugging percentage (third-best in baseball last season) in plate appearances lasting three or less pitches.

It seems opposing managers will have to pick their posion against Trout, especially when he comes to the plate. Do you try to pound the edge of the zone and go deep into counts against him and run the risk of him getting on base at a league-best rate, or do you throw over the plate early and thus leave open the possibility of him battering your pitcher with extra-base hits?

Either way, you're in trouble.

Friday
Sep202013

Can Lefty-Killer Liriano Tame Cincinnati's Lineup?

The Cincinnati Reds and Pittsburgh Pirates, currently holding the National League's two Wild Card spots and still chasing the St. Louis Cardinals for NL Central supremacy, begin a pivotal series tonight at PNC Park. The Bucs' ace and the winter's biggest free agent bargain, Francisco Liriano, will square off against a Cincy lineup led by on-base machines Shin-Soo Choo and Joey Votto and slugger Jay Bruce.

The Reds' three key lefty bats could be in for a long night against Liriano, who is mowing down fellow southpaws like no other starting pitcher in major league history. He's holding them to a .319 on-base-plus-slugging percentage in 2013, lowest ever for a lefty pitcher facing at least 100 lefty batters in a season. The big league average in lefty-versus lefty situations is just .645. Tonight's game could come down to whether Choo, Votto and Bruce can lay off Liriano's slider.

No National League starter this side of Madison Bumgarner throws his slider as often as Liriano (36% overall), and he relies on that high-80s missile even more against lefties (42%). He locates his slider off the outside corner to left-handers, just close enough to the edges that hitters feel compelled to swing once Liriano has bullied them into a pitcher's count.

Pitch location of Liriano's slider vs. lefties, 2013

Lefty hitters can't resist those tantalizingly close sliders, chasing them out of the strike zone 43% of the time. Liriano's chase rate with his slider against lefties is seventh-highest among starters, comfortably topping the 36% average and beating the likes of Clayton Kershaw (41%), Derek Holland (37%) and Chris Sale (35%).

Lefty hitters' swing rate by pitch location vs. Liriano's slider, 2013

Thanks to such an expanded strike zone, Liriano has a .076 opponent slugging percentage when he unleashes a slider to a lefty batter. That's best in the bigs and over 200 points below the MLB lefty-on-lefty average (.285).

So, how do the Reds' left-handers match up against the game's ultimate lefty hit man? Votto and Bruce probably aren't sweating Liriano. Choo, by contrast, must be drenched.

Votto has handled same-handed pitching over the past three seasons, posting a .908 OPS in 573 plate appearances against lefties. In fact, no qualified lefty hitter has a higher OPS against lefty pitching over that time frame. He's nearly platoon-proof in part because his Gandhi-like discipline extends to those tempting lefty sliders. Votto has chased just 28% of the time since the start of the 2011 season. Votto's patient approach has helped him slug a respectable .364 versus lefty sliders.

Bruce hasn't been shut down by lefties, either (.770 OPS in 602 PA). While he's much more of a free swinger than Votto overall -- who isn't? -- Bruce has chased lefty sliders off the plate 29% of the time. He's slugging .327 versus lefty sliders from 2011-13.

And then there's Choo. Maybe he wears that batting helmet with double ear flaps because he's wistfully thinking about taking up switch-hitting: Choo has a .617 OPS versus same-handed pitching in 569 PA from '11 to '13. He also shows good discipline versus lefty sliders (29% chase rate), he just can't hit them (.138 slugging percentage). Might be a good night for Choo to come down with a sudden case of Liriano-itis.

Monday
Aug262013

Looking out for number three

When you are looking at the number three batter in most lineups, invariably you are looking at the best hitter on a player's team. 

Number three versus the clean-up batter in the lineup

There certainly have been times when the slugger in the number four slot was the man.

At least, that's what we grew up with fantasizing about.

I mean the number four guy in the line was the clean-up batter. He actually had a name because we pictured the first three guys getting on base and then the number four guy would clean up the bases with a big hit.

Isn't that why Lou Gehrig had so many grand slams?

But the reality is the number three batter has been the hitter to watch out for. Babe Ruth, Ted Williams, Willie Mays, and even Mickey Mantle were all primarily number three hitters.

Comparing number three and number four

Take a look at how the top 2013 team's number threes versus number four batters in the lineup have done.

Top 10 number three batters by team
  PA AVG OBP SLUG OPS HR BB K RBI
Detroit Tigers (DET) 606 .340 .431 .639 1.070 42 82 91 136
Pittsburgh Pirates (PIT) 575 .315 .395 .509 .904 19 62 86 75
Cincinnati Reds (CIN) 598 .314 .430 .504 .934 20 100 115 62
Kansas City Royals (KC) 565 .300 .366 .443 .809 16 52 72 77
San Francisco Giants (SF) 575 .296 .339 .458 .796 17 33 70 82
Colorado Rockies (COL) 584 .295 .363 .560 .923 32 56 148 83
Boston Red Sox (BOS) 605 .295 .370 .408 .778 8 63 66 71
New York Yankees (NYY) 563 .289 .361 .472 .832 23 53 89 83
New York Mets (NYM) 573 .288 .361 .472 .833 19 55 99 63
Cleveland Indians (CLE) 578 .288 .362 .475 .837 16 59 123 83
2013 Cleanup batters by team
  PA AVG OBP SLUG OPS HR BB K RBI
Colorado Rockies (COL) 570 .334 .391 .557 .948 26 48 104 106
Texas Rangers (TEX) 559 .328 .379 .544 .923 28 39 59 76
Los Angeles Dodgers (LAD) 560 .321 .382 .498 .880 16 47 103 78
St. Louis Cardinals (STL) 568 .320 .382 .482 .864 16 46 98 94
Boston Red Sox (BOS) 592 .313 .380 .574 .954 30 60 99 104
Washington Nationals (WSH) 552 .296 .377 .494 .871 22 62 114 83
Tampa Bay Rays (TB) 559 .295 .367 .497 .864 21 59 117 74
Baltimore Orioles (BAL) 555 .294 .328 .538 .866 32 23 111 107
San Francisco Giants (SF) 561 .278 .351 .451 .802 16 54 81 70
Atlanta Braves (ATL) 563 .278 .350 .460 .810 21 52 115 94

Look at the variance in the number three slot

Baseball's number three batters are interesting lot.

Baseball's #3 Batters - min. 300 PA
  PA AVG OBP SLUG K% BB% HR BB RBI Swng% Chas% P/PA
Miguel Cabrera (DET) 550 .358 .449 .684 14.5% 13.6% 42 75 128 50.4% 28.8% 3.69
Andrew McCutchen (PIT) 537 .318 .399 .509 14.7% 11.2% 17 60 71 46.2% 22.3% 3.77
Joey Votto (CIN) 585 .314 .432 .507 19.1% 17.1% 20 100 61 38.9% 16.7% 4.13
Robinson Cano (NYY) 355 .314 .389 .495 13.5% 11.0% 13 39 52 46.2% 28.7% 3.78
David Wright (NYM) 456 .308 .393 .514 16.2% 11.4% 16 52 53 45.1% 20.9% 3.78
Carlos Gonzalez (COL) 417 .299 .367 .591 26.9% 9.6% 25 40 67 48.2% 32.9% 3.89
Dustin Pedroia (BOS) 593 .299 .374 .415 11.0% 10.6% 8 63 71 42.4% 24.4% 4.12
Paul Goldschmidt (ARI) 501 .292 .394 .542 19.8% 14.2% 28 71 88 40.5% 20.4% 4.17
Jason Kipnis (CLE) 303 .283 .372 .445 21.1% 12.9% 7 39 44 39.1% 17.8% 4.31
Alex Rios (CWS) 460 .279 .329 .425 16.5% 6.7% 12 31 55 43.8% 24.7% 3.73
Adrian Gonzalez (LAD) 422 .277 .322 .446 14.7% 6.6% 15 28 60 51.5% 33.6% 3.66
Jason Castro (HOU) 323 .271 .341 .455 26.6% 9.3% 10 30 32 45.6% 27.4% 4.03
Nick Markakis (BAL) 383 .263 .326 .370 8.6% 8.4% 8 32 30 42.1% 24.5% 3.74
Matt Holliday (STL) 400 .263 .343 .455 15.3% 9.8% 15 39 55 50.9% 27.7% 3.70
Albert Pujols (LAA) 443 .258 .330 .437 12.4% 9.0% 17 40 64 45.8% 29.8% 3.79
Justin Upton (ATL) 396 .255 .347 .455 25.3% 11.9% 16 47 46 44.8% 21.6% 4.07
Giancarlo Stanton (MIA) 372 .251 .363 .470 26.3% 14.5% 16 54 40 41.4% 26.7% 4.18
Chase Headley (SD) 371 .225 .329 .356 25.1% 11.3% 7 42 30 44.9% 24.4% 3.94
Anthony Rizzo (CHC) 438 .220 .313 .420 19.6% 11.2% 16 49 56 44.5% 26.5% 3.92

When you look at Miguel Cabrera, you see not the just best number three in baseball, you are looking at the best hitter in the game, on his way to historical greatness.

Andrew McCutchen potentially is on his way to being the NL MVP.

Joey Votto is a great player, but he is the reason why this chart includes walks, swing percentage, and chase percentage. There are many folks out there who get frustrated with Joey's selectivity and when you compare him to his peers, you can see why.

Robinson Cano, is the present and immediate future for the Yankees, if they can retain him. These numbers show you why Jay Z is feeling good about his client.

There is a reason why David Wright is called Captain America, and it's not just because of his good looks. He has good numbers in the three slot.

Carlos Gonzalez is a lifetime .300 hitter.

Dustin Pedroia is the anomaly on this list. The again, when you look at baseball's great players, Pedey is an anomaly in almost every respect.

Paul Goldschmidt is another NL MVP candidate as is Adrian Gonzalez.

Then you have the rest of Gilligan's Island in this select group.

The moral of the story

The moral of this story is very simple:

"If you are a pitcher, be less involved about thinking about number one...you're better off when you focus on number three."

Page 1 2 3 Next 3 Entries »