Jim Johnson is out of control
 Bill Chuck - Managing Editor |
 It's bad enough for closer Jim Johnson that his Orioles had dropped six straight contests, prior to last night's victory over the Yankees, but Johnson has now blown three consecutive 9th inning saves.
Johnson was the beneficiary of Nate McLouth's 10th inning walkoff homer last night and earned the win with a perfect top of the 10th retiring the Yanks on line out, fly out, and pop out to get the victory.
The question is, "what is going on with Johnson in saves situations?"
Nine to Know
Since the start of the 2008 season, nine relievers have had streaks of at least three blown saves
| Rk | Strk Start | End | Games | W | L | GF | IP | H | R | ER | BB | SO | HR | Tm | |
|---|---|---|---|---|---|---|---|---|---|---|---|---|---|---|---|
| 1 | Matt Thornton | 2011-04-06 | 2011-04-13 | 4 | 0 | 2 | 0 | 4.0 | 10 | 10 | 4 | 3 | 3 | 1 | CHW |
| 2 | Tyler Clippard | 2010-05-06 | 2010-05-11 | 4 | 3 | 1 | 1 | 4.1 | 8 | 4 | 4 | 3 | 5 | 1 | WSN |
| 3 | Jim Johnson | 2013-05-14 | 2013-05-20 | 3 | 0 | 2 | 1 | 2.1 | 9 | 8 | 8 | 2 | 1 | 2 | BAL |
| 4 | Jordan Walden | 2011-06-22 | 2011-06-27 | 3 | 1 | 1 | 1 | 3.1 | 3 | 3 | 3 | 2 | 0 | 1 | LAA |
| 5 | Brandon League | 2011-05-10 | 2011-05-13 | 3 | 0 | 3 | 3 | 1.2 | 9 | 7 | 7 | 0 | 1 | 1 | SEA |
| 6 | Ryan Webb | 2011-04-25 | 2011-04-30 | 3 | 0 | 0 | 0 | 1.1 | 4 | 1 | 1 | 1 | 0 | 0 | FLA |
| 7 | Nick Masset | 2011-04-10 | 2011-04-13 | 3 | 0 | 2 | 2 | 3.1 | 7 | 6 | 6 | 4 | 1 | 1 | CIN |
| 8 | Billy Wagner | 2008-06-08 | 2008-06-12 | 3 | 0 | 1 | 1 | 2.1 | 6 | 6 | 6 | 2 | 4 | 2 | NYM |
| 9 | Hideki Okajima | 2008-04-22 | 2008-04-30 | 3 | 0 | 0 | 0 | 3.2 | 5 | 1 | 1 | 1 | 5 | 1 | BOS |
As you can see, not only has Johnson blown three straight saves but has given up more runs than any of the other relievers
This blown save streak was particularly surprising in light of the fact that Johnson had been running a streak of 35 straight converted save opportunities going back to last July 30.
From July 30, 2012 to May 10, 2013
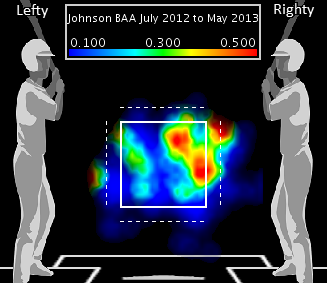
- Johnson appeared in 45 games, throwing 44 innings.
- He earned 35 saves, had no blown saves and had a record of 2-2.
- He allowed three runs on 30 hits including just one homer and three doubles.
- He walked eight and whiffed 34.
- He held batters to a .196 batting avg., a .241 OBP and a .241 slugging pct.
- Of the 645 pitches thrown, approximately 50% of them were in the strike zone, with 74.3% fastballs (477) with an average velocity of 93.8 mph.
- Batters put 119 balls in play with 64 (53.8%) grounders
The blown save streak May 14 to May 20, 2013 (still active)
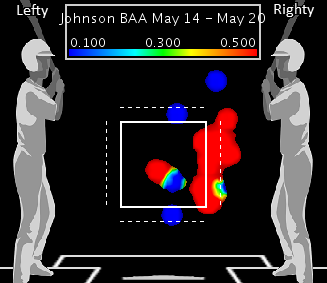
- Johnson appeared in three games, throwing 2.1 innings.
- He earned no saves, has had three blown saves and a record of 0-2.
- He has allowed eight runs on nine hits including two homers and one double.
- He has walked two and whiffed one.
- Batters are battering him with a .643 batting avg., a .706 OBP and a 1.143 slugging pct.
- Of the 69 pitches thrown, approximately 35.3% of them were in the strike zone, with 70.6% fastballs (48) with an average velocity of 93.9 mph.
- Batters put 13 balls in play with six (46.1%) grounders, three which went for hits.
The problem seems to be Johnson's control in and out of the strike zone.
Of Johnson's 69 pitches, only 24 have been in the zone.
Batters have chased 11 pitches and Johnson has picked up just seven called strikes and five swings-and-misses.
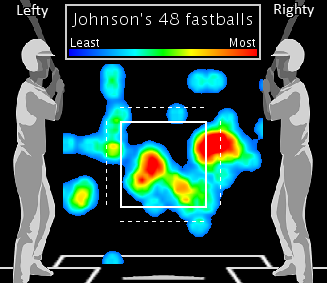
Johnson's been all over the place
Johnson has thrown 48 fastballs over the last three games and batters are sitting on the pitch going 8-for-11 knowing Johnson has trouble locating it as you can see in the heat map below.
Johnson is a good reliever who was pitching over his head and is now in a saves slump. Perhaps last night's game will straighten him out. However, you want your reliever throwing strikeouts and ground outs, not allowing balls in the air.
Look at Johnson's 2012 numbers:
- 15.2% strikeouts
- 12.3% ground balls
- 3.6% line drives
- 3.8% fly balls
- 0.8% pop-ups
Look at Johnson's 2013 numbers:
- 19.8% strikeouts
- 8.4% ground balls
- 3.9% line drives
- 4.5% fly balls
- 1.4% pop-ups
Yes, his strikeouts are up this season but his balls in the air are also up. This is probably why his BAbip is up from .252 to .306.
There are few better baseball minds than Orioles pitching coordinator Rick Peterson and pitching coach Rick Adair. Unless there is something physical bothering Johnson, I expect to see a Johnson recovery coming shortly.
Reader Comments (1)
Johnson is a ground ball pitcher...............simply......he is not getting the ball down in the zone